In Milpitas, the Average and the Median Have Stopped Agreeing With Each Other
Pull up two different pages for the same Milpitas neighborhood right now and you'll find two different stories. One says prices are climbing sharply. The other, based on a three-month median rather than a monthly average, says they're falling. Neither page is wrong. They're just measuring different things, and the gap between them is wide enough that it changes how you should think about pricing a Milpitas home this year.
Take Central Milpitas. The average sale price there was $2.2 million as of the most recent monthly update, up 18.9 percent from a year earlier. Meanwhile the median sale price over the three months ending in May 2026 was $1.3 million, down 6.6 percent from the same period the year before. Same neighborhood. Same data source. One number says the market got richer. The other says the typical home actually sold for less.
This isn't a typo, and it isn't unique to Central Milpitas. It's showing up across the city's submarkets at the same time, and it's worth understanding before you anchor a listing price or an offer to a headline you saw on a portal.
An average and a median measure different things, and the smaller the number of sales, the more they can pull apart. The average adds up every sale price and divides by the count, so one $4 million estate or one distressed teardown can drag the whole figure in a direction that has nothing to do with the broader trend. The median just finds the middle sale, the one that split the pack in half, and it tends to reflect what a "typical" buyer actually paid.
In a market with hundreds of monthly closings, that difference rarely matters much. In a Milpitas submarket with a dozen sales a month, it matters enormously. Central Milpitas closed only 12 homes in May 2026, down from 19 the year before. Northeastern Milpitas closed just 4 homes in May, down from 9. When your sample size is that small, a single high-end sale or a single distressed one can swing the average by double digits while the median barely moves, or moves in the opposite direction entirely.
That's exactly what's happening. Northeastern Milpitas posted an average sale price of $1.44 million, down 28 percent year over year, while its three-month median climbed to $2.3 million, up 41.4 percent. Northwestern Milpitas showed an average up 6.2 percent alongside a median down 15.2 percent. Southeastern Milpitas told the same split story: average up 8.9 percent, median down 6.0 percent. Four submarkets show four pairs of numbers pulling in opposite directions, comparing monthly averages with three-month medians.
| Milpitas submarket | Average sale price, most recent month | Median sale price, 3-mo. trailing | Homes sold, most recent month | Days on market |
|---|---|---|---|---|
| Central Milpitas | $2.2M, up 18.9% YoY | $1.3M, down 6.6% YoY | 12 (down from 19) | 11 |
| Northeastern Milpitas | $1.44M, down 28.0% YoY | $2.3M, up 41.4% YoY | 4 (down from 9) | 11 |
| Northwestern Milpitas | $1.54M, up 6.2% YoY | $1.4M, down 15.2% YoY | 23 (up from 17) | 23 |
| Southeastern Milpitas | $1.75M, up 8.9% YoY | $1.5M, down 6.0% YoY | 20 (up from 18) | 21 |
| Milpitas citywide | $1.32M, down 17.1% YoY | $1.3M, down 9.53% YoY | 122 (up from 106) | 15 |
Notice that the citywide row is the only one where average and median roughly agree. That's the law of large numbers doing its job: with 122 sales spread across the whole city, one outlier sale doesn't move the needle much. But almost nobody buys or sells "citywide." They buy a house in Central Milpitas or a townhome off Trade Zone Boulevard, and at that level the sample shrinks to a size where any single closing can rewrite the story.
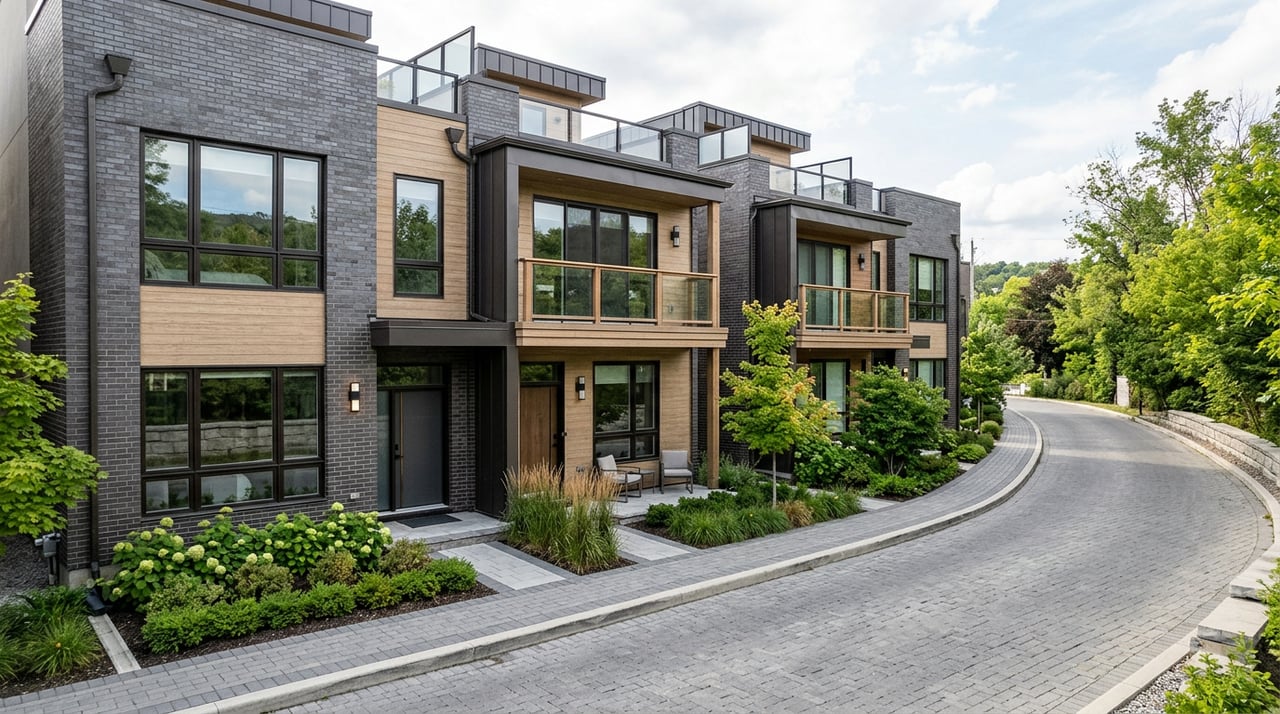
Part of why these small samples are swinging so hard right now is that new product is landing directly in the price tiers these submarkets used to fill with resale homes. Toll Brothers opened Parkside West, a townhome-style condo community at 675 Trade Zone Boulevard, within walking distance of the Milpitas BART station and VTA light rail, with pricing starting from $1.25 million. Pulte's community known as The District has offered three-bedroom townhomes in the 1,518 to 2,175 square foot range, with some plans marketed from the low $1.1 million range. Both sit alongside older condo stock like Centria, a mid-2000s development that still trades at a meaningfully lower price point than the newer construction around it.
When a handful of brand-new $1.2 million townhomes close in the same month as a couple of older $900,000 condos and one $3 million single-family renovation, the median can jump or drop by six figures depending on which few sales happened to close. That's not a market correction. It's a mix effect, and it's concentrated in exactly the BART-adjacent submarkets where the average-median splits are widest.
This clustering isn't an accident. The city's Milpitas Metro Specific Plan, adopted in February 2023 as an update to the original 2008 Transit Area Specific Plan, expanded the planning area to roughly 510 acres specifically to keep steering development toward the transit hub at Montague Expressway and Great Mall Parkway. The city is also finishing the South Milpitas Boulevard extension, a $15.7 million project connecting Tarob and Sango Courts with a new bridge, largely funded through development impact fees collected under that same plan. The infrastructure and the housing mix are being built together, which is part of why the submarkets closest to the station look so different from month to month than the ones farther out.
If you're selling in Central, Northeastern, Northwestern, or Southeastern Milpitas, a city-wide "median down 9.5 percent" headline tells you almost nothing useful about your own block. Ask for the actual closed comps in your specific pocket over the last 60 to 90 days, not just the trailing 12-month average, and look at how many sales those numbers are built on. A trend built on 4 or 12 sales isn't unreliable, but it is more sensitive to whichever properties happened to close, and a good agent should walk you through which of those recent sales look like true comps for your home and which are outliers pulling the average around.
If you're buying, the same caution applies in reverse. A submarket showing a big average increase might just mean one luxury sale closed, not that entry-level inventory got more expensive. And if you're comparing an older Centria-style condo against something newer like The District or Parkside West, remember you're not just comparing square footage. You're comparing a unit built to 2026 code and HOA structure against one built two decades earlier, and that difference shows up in the reserve study and monthly dues as much as in the sale price.
Is Milpitas a buyer's market or a seller's market right now? It depends on which submarket and which measure you're reading. Northeastern and Northwestern Milpitas still show Redfin competitiveness scores in the high 70s to mid 90s, meaning most homes are getting multiple offers, while the citywide score sits closer to 56, described as somewhat competitive. The honest answer is that Milpitas isn't one market to call a winner or loser in this year. It's several small ones, and each deserves its own read.
Why did the number of homes sold drop in some neighborhoods but rise in others? Central and Northeastern Milpitas both saw fewer closings this May than a year earlier, while Northwestern and Southeastern Milpitas saw more. With such small monthly counts in the first two areas, a slow month or a single big closing can swing the median substantially, which is part of why those two submarkets show the widest average-median gaps.
Should I trust the price per square foot instead of the median or average? Price per square foot is a useful third data point because it partly controls for home size, but it still gets pulled around by which specific homes sold, whether newer or older, renovated or not. The most reliable read comes from looking at all three measures together alongside the actual number of closings behind them, which is exactly the kind of neighborhood-level digging worth doing before you set a list price or make an offer.
If you're trying to make sense of what your specific Milpitas street is actually doing this year, that's the conversation worth having before you price anything. Janet Souza works these submarkets closely enough to know which recent closings are real comps and which are outliers skewing the average, and can walk you through a current read on your neighborhood specifically. You can start with a home valuation or reach out directly to schedule a chat.

Hello! I'm Janet Souza, lifestyle blogger and REALTOR® at Christie's International Real Estate Sereno. I live and work in Silicon Valley and love everything our wonderful area has to offer. If you live in Silicon Valley or are thinking about moving here, you've come to the right place! Stay up to date with local events, theater, concerts, Real Estate and more!

Cookies
Enjoy the delightful marzipan-type filling!


Fundamental to how Janet Souza views her role as her client’s real estate advisor, she seamlessly blends her former professional worlds that span consulting, engineering, marketing, strategy, and executive sales negotiations as her frame of reference, bringing a premier standard of performance and uncompromised integrity to her clients.